|
|
Visual Map
This feature helps security administrators locate devices and visualize events from a single screen. It displays the location of devices and events on graphical maps and floor plans. IXM WEB system application users can upload multiple floors with different floor plans. This module consists of two sections:
-
Setting up all structures including device/doors, and events selection.
-
Real-time monitoring of events based on selected device/door.
Screen Layout of Monitoring

Field Description of Monitoring
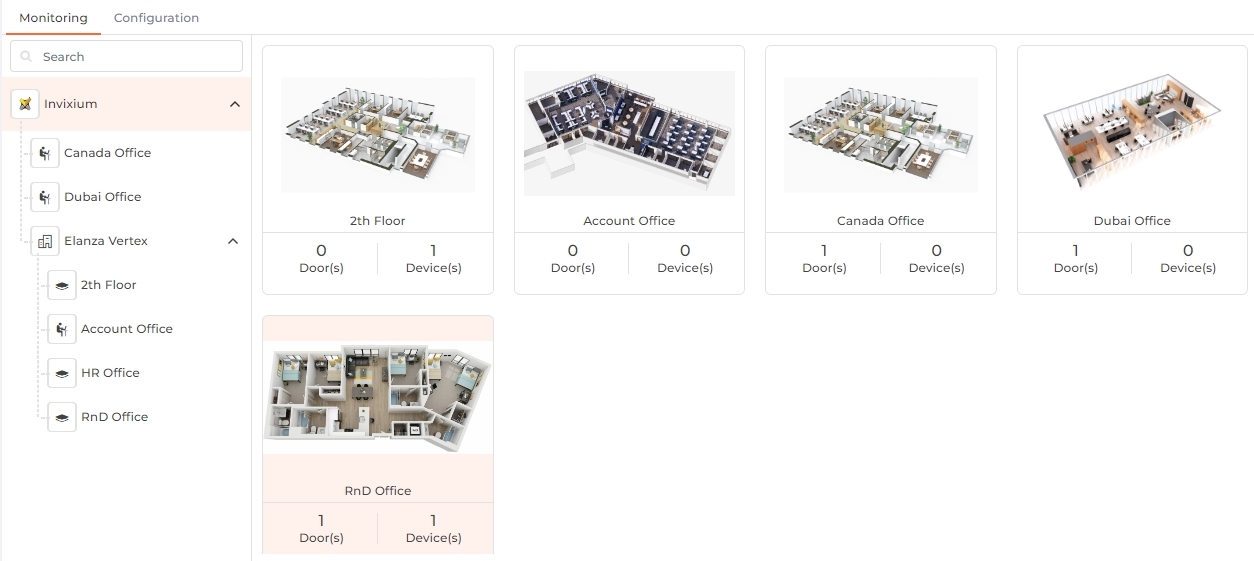
The Visual Map monitoring feature displays the events and device locations on graphical maps and floor plans. This monitoring screen is used to observe live events in real time.
Click on the desired Structure. All the Floor or Office plans belonging to that Structure along with the count of Doors and Devices within them will be displayed.
Click on the desired plan to open it in full-screen mode. The plan will be shown with all the Doors and Devices added to it.
Alternatively, click on the Open in New Tab button at the top right corner of the screen to view the plan in standalone full-screen mode.

|
NOTE
|
View the live events in real-time by clicking on the < icon at the top right corner of the screen as shown below.
![]()
A list of current events taking place in real-time will be displayed:

Click on the ![]() icon at the top of the Event List to filter the events for a particular Device.
icon at the top of the Event List to filter the events for a particular Device.
Delete all the current events by clicking on the ![]() icon at the top of the Event List.
icon at the top of the Event List.
|
NOTE
|
Screen Layout of Configuration

Field Description of Configuration
Use this section to create or modify a Visual Map structure. A structure supports the following three levels:
-
Building
-
Floor
-
Office
Users have the option to upload a 2D floor map in various image formats such as .jpg, .png, .bmp, or .jpeg to a specific structure. This floor map serves as a foundation for adding doors and devices at any desired location within the image or the designated area.
Click on the Create button and select the level to be added. For example, ‘Building’ in this case.
.jpg)
Name:
Enter the name of the level being added. For example, ‘Elanza Vertex’ is the name of the building.
Level:
Select the level from the dropdown list. For example, ‘Building’ is the first level to be added.
Click on the Save button to create the level or the Cancel button to discard the action.
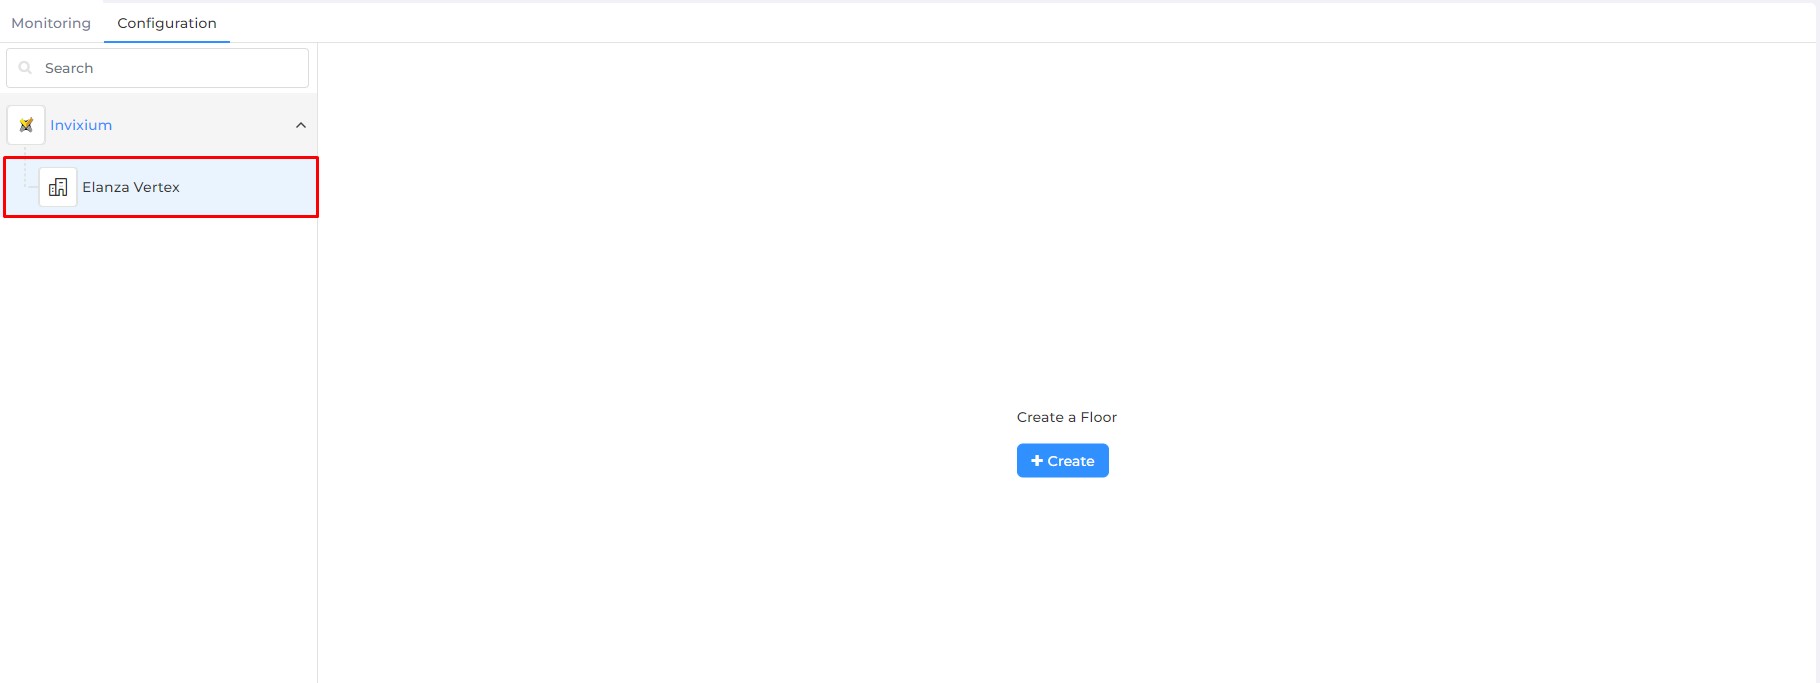
Upon saving the level, the structure will be displayed as follows:

|
NOTE The default Company Name specified through Organization Hierarchy > Company will be displayed at the topmost level and can not be changed.
|
To create the next level, select the parent level in the Visual Map Structure.
Alternatively, you can manage the levels from the Visual Map Structure. Hover the mouse over the level in the map to access the following options:
-
Add a level: Click on the + icon to add a level under the selected level.
-
Edit a level: Click on the
 icon to edit the selected level.
-
Delete a level: Click on the
 icon to delete the selected level.
Next, click on the Create button and select the level to be added. For example, ‘Floor’ in this case.
.jpg)
Name:
Enter the name of the level being added. For example, ‘Second Floor’ is the name of the floor.
Level:
Select the level from the dropdown list. For example, ‘Floor is the second level to be added.
Click on the Save button to create the level or the Cancel button to discard the action.
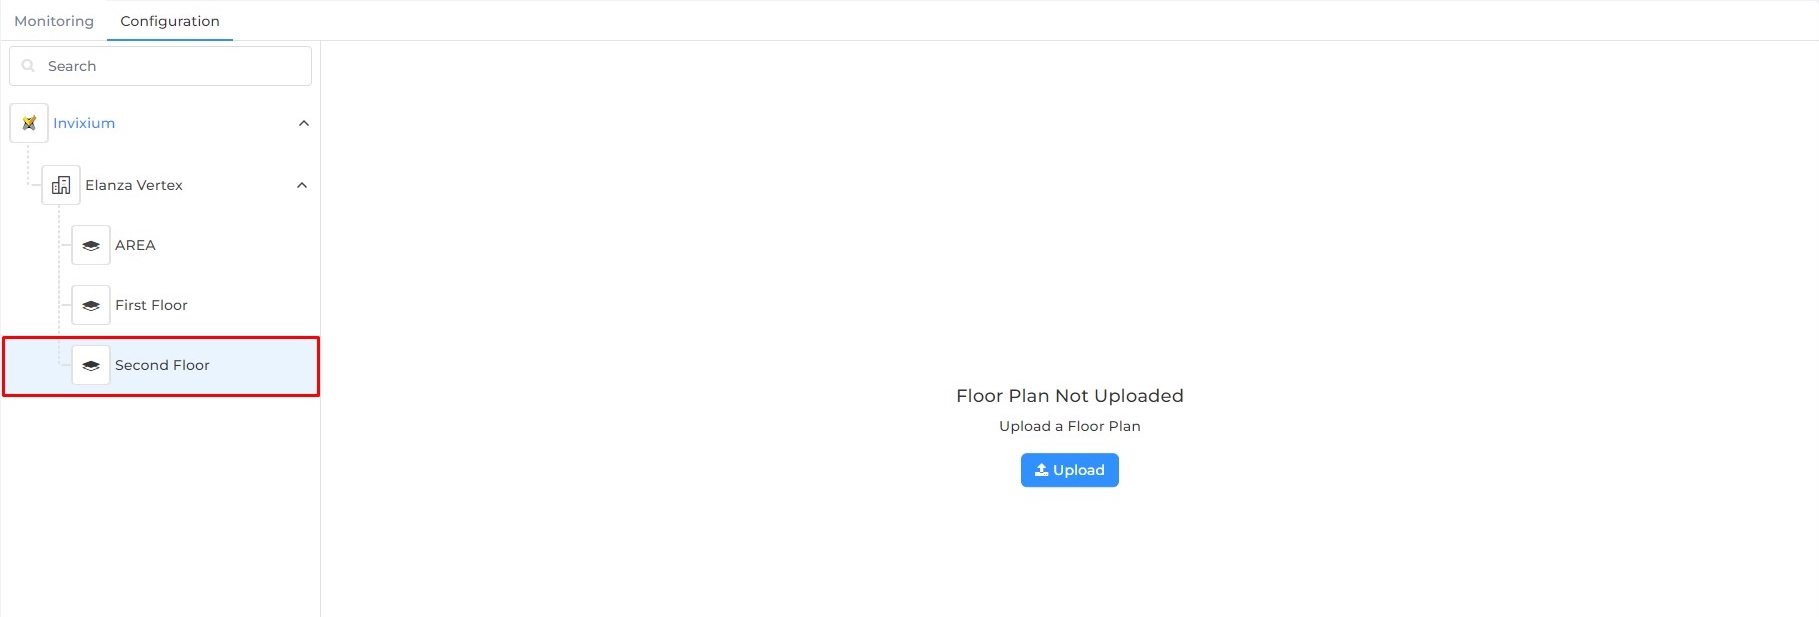
Upon saving the level, the structure will be displayed as follows:

Either upload an image of the floor or create an Office inside the floor. Read how to upload map...
To create an Office inside the floor, hover over the floor in the Visual Map Structure and click on the + icon to add an Office.
Users have the option to upload a 2D floor map in various image formats such as .jpg, .png, .bmp, or .jpeg to a specific structure. This floor map serves as a foundation for adding doors and devices at any desired location within the image or the designated area.
Select the Floor or Office on the Visual Map Structure. Click on the Upload button.

Select the image of the floor plan from its appropriate path. Once uploaded, the image will be displayed as follows:

|
NOTE
|
Once a Floor or Office is added to a Building, Devices can be added to that Floor or Office.
Select the Floor or Office on the Visual Map Structure and click on the Add Device button in the top right side of the screen.

The following screen will be displayed:

Select Device:
Select the online Device from the dropdown list.
|
NOTE A device can be added to one floor only. Once the device is selected, it won’t be available for any other Floor or Office. |
Select Events:
Select the Events to monitor the Device.
Please refer to the Events section for more information.
Click on the Save button to add the Device or Cancel button to discard the action.
|
NOTE
|
Once a Floor or Office is added to a Building, Doors can be added to that Floor or Office. Multiple devices can be selected for doors.
Select the Floor or Office on the Visual Map Structure and click on the Add Door button in the top right side of the screen. The following screen will be displayed:

Name:
Enter the name of the Door.
Select Devices:
Select the online Device from the dropdown list.
|
NOTE Multiple devices can be selected for a Door. |
Select Events:
Select the Events to monitor the Door.
Please refer to the Events section for more information.
Click on the Save button to add the Door or Cancel button to discard the action.
|
NOTE
|
Click on the respective checkbox of each Event to enable or disable the feature. A check mark indicates the feature is enabled.
The following Events are supported:
| # | Events | Details |
| 1 | Device Network Status - online / offline | The device icon will change to notify this event to the administrator |
| 2 | Door Status - open/close | The device icon will change to notify this event to administrator and the event taking place on selected Device(s) will be displayed live. |
| 3 | Alarms: Door Open Too Long, Door Forced Open, Anti-Shock (Tamper), Fire | The device icon will change to notify this event to administrator and the event taking place on selected Device(s) will be displayed live. |
| 4 | Events: Access Granted and Denied Events | The event taking place on selected device(s) will be displayed live. |
|
NOTE When an event is selected, its paired event will be selected automatically. |
The following options are available to configure the settings:
-
Manage Icons
Hover on the Settings button on the top right corner of the screen. Select the Manage Icons option from the list.
This option allows you to change the icon for each Event.

Hover on a particular Even and click on the
 icon. Now select the desired image from its respective path.
 -
Reset
Hover on the Settings button on the top right corner of the screen. Select the Reset option from the list.
This option allows to delete a Floor or Office and Devices/Doors of the selected structure. The application will display a confirmation message.
-
Change Floor Plan
Hover on the Settings button on the top right corner of the screen. Select the Change Floor Plan option from the list.
This option allows you to change the image of the floor plan. Added devices and door coordination will remain in the same position as before. Only the image will be changed. If coordination is not settled based on the new image, you will have to set it manually.